The K shape economy and the Roaring Fork valley Real Estate Market

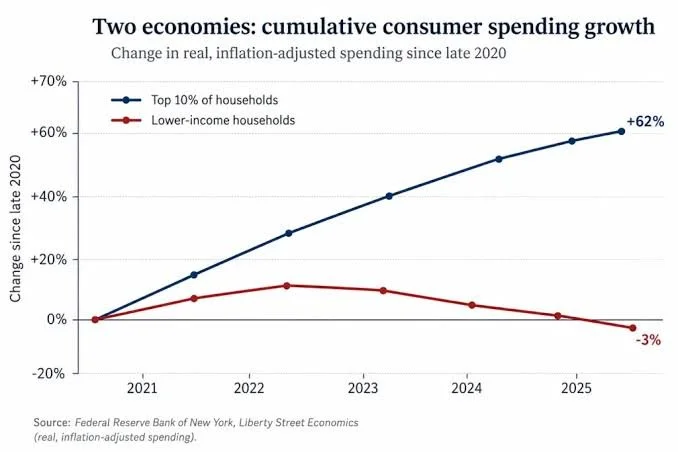
You might have heard about the K shape economy (read more). Economists use it to describe the current economic environment: in a nutshell, the rich are getting richer, and the poor are getting poorer. Meanwhile the middle class is disappearing. Once you notice the signs of the K shape economy, its hard not to see it everywhere you look: consumption, income, taxation, cars, groceries, asset prices, asset transaction volume etc… Including in our very own Roaring Fork Valley real estate market!
The K shape economy commands some very unique market dynamics, and I hope that reading about them in this article will be insightful, and provide you with the guidance you need to buy or sell your home. Reach out if you have remarks or questions!
The K shape economy
Source: US Federal reserve
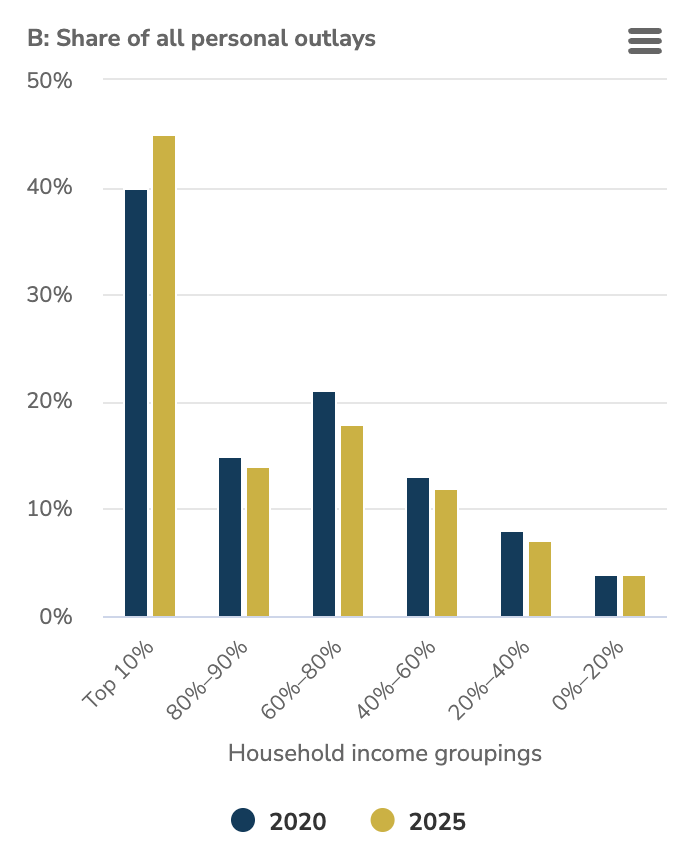
As you can see on the chart above, almost half of the total consumption in the US in 2025 was due to the top 10% of earners, and that share is increasing. Meanwhile the bottom 90% see their slice of the cake shrink between 2020 and 2025.
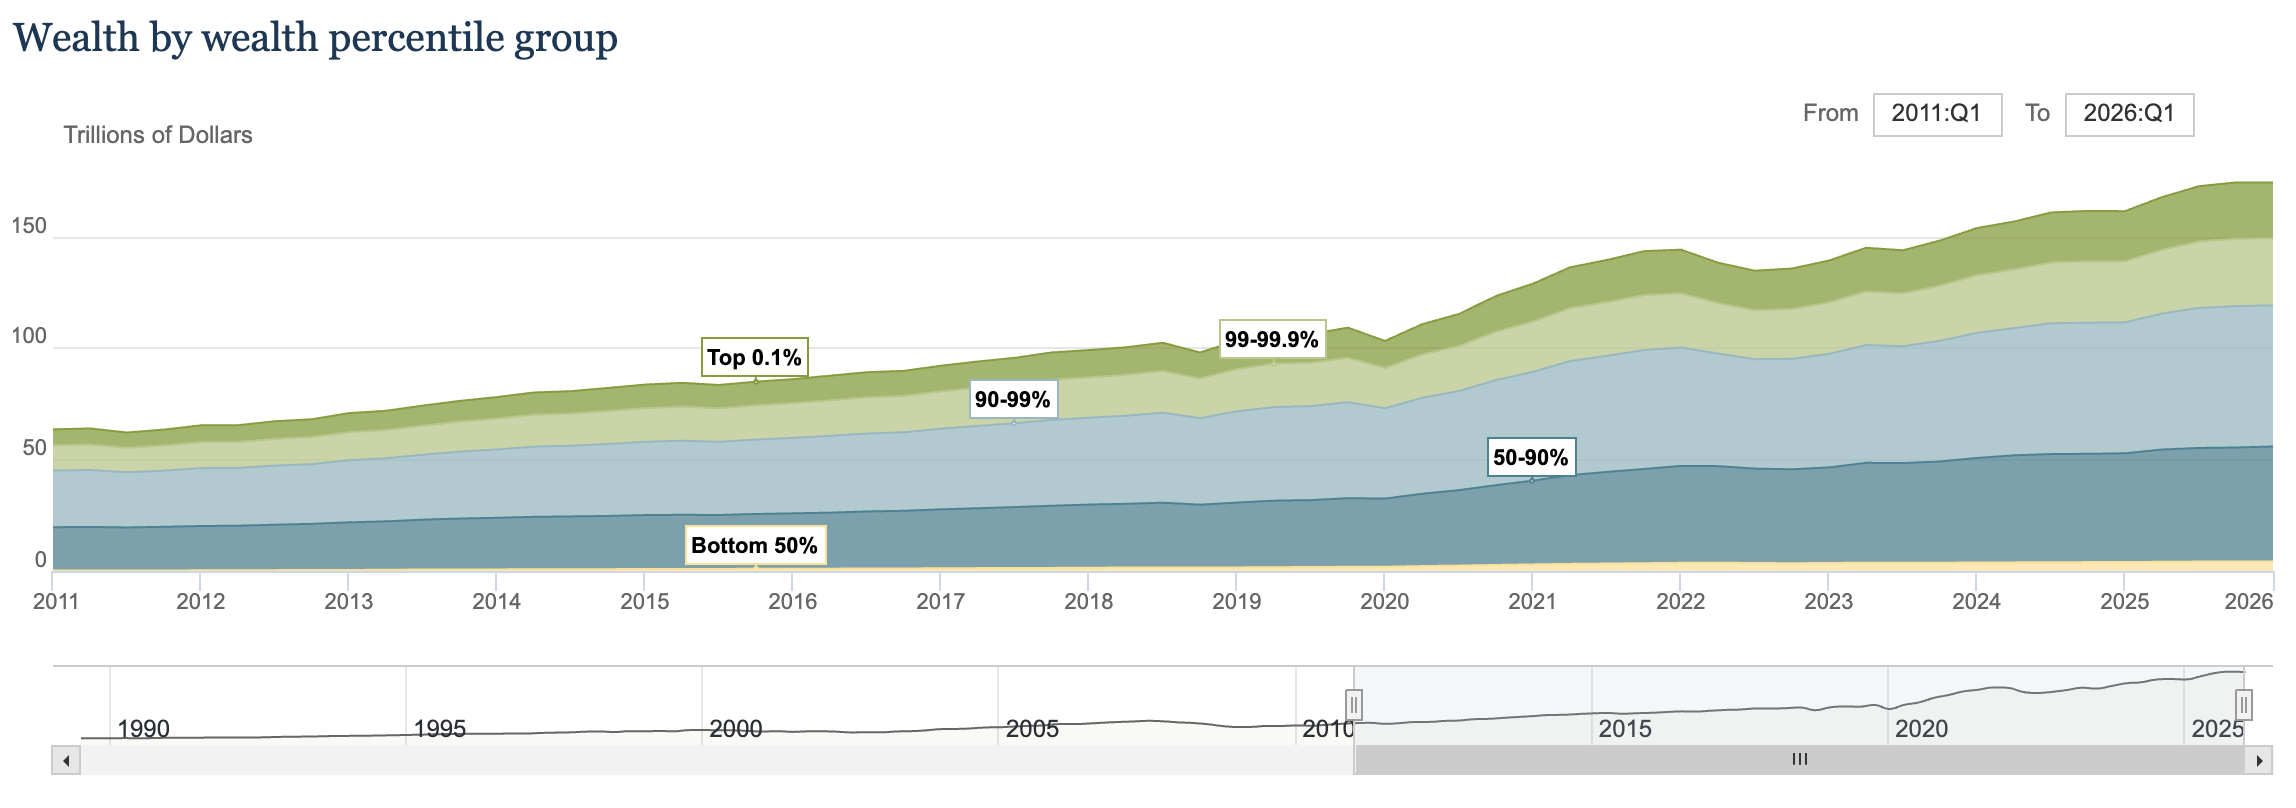
Income inequality is stark, but the disparity in wealth is is breaking records, with the the bottom 50% barely showing on the graph below while the top 0.1% increase their ownership of assets in just the last 2 years by a margin bigger than the total ownership of the bottom 50% in 2025.
Source: US Federal reserve
Inflation plays an important role in this trend. Most consumer goods are getting more expensive, squeezing the wallets of the bottom of the K as a higher share of their income is used for consumer spending. Meanwhile the rich see their assets value go up during inflationary times, providing a tailwind that other demographic lack.
At this point, and to provide a more real estate oriented perspective, I’d like to highlight the fact that high interest rates exacerbate the K shape economy. Although the Federal Reserve can’t lower rates without risking the economy to overheat, and create more inflation, their high rates policy also makes lower income people have to pay higher mortgage rates in order to purchase a home. It creates more hardship to access homeownership and hurts their prospects of owning a home. A home is the main asset that most lower income household typically own, and the source of most of their wealth. So inflation contributes to the K shape economy, and only makes it worse by driving interest rates up. Look for inflation numbers and interest rates to give you an indication where things are going! Higher inflation/high rates means the K shape economy continues, and lower inflation/low rates means it might change.
How is the K showing up in the RFV real estate?
Some of the data from the RFV real estate market seem contradictory. Yet looking at it through the lens of the K shape economy actually helps make sense of it. For example:
Why is everybody feeling like housing in so unafordable, yet prices keep going up? There is very little for sale out there, and the wealthier buyer (upper part of the K) are purchasing the properties available for sale at a very high price. Price is set by the latest comparable sale and when sales volume are low, prices can keep rising thanks to just a few sales, while everybody else is feeling squeezed and hunkering down, staying out of transactions.
Why are houses between $1m and $1.5m seems to have a hard time selling, while you can find $2.5m properties actually selling in the Glenwood area? Because house between $1m and $1.5m are not affordable for a household who is working for their mortgage payment, but it’s also not a luxury product that’s a good fit for the wealthy. They are in no man’s land, in the soft middle of the K. So a bigger, better house in the same area might sell for $2.5, while an average home, not built for luxury, in the same neighborhood might not find a buyer.
How is the supply of homes for each side of the K?
Now that we established that the demand for homes is either at the top , or the bottom of the price range, forming a K, how does the supply of home responding? Well, you might have guessed it, the top of the K and the middle of the K is generally over supplied, and the bottom of the K is under supplied. In other words, there aren’t enough affordable homes, and too many luxury and “wannabe luxury” homes for sale (homes that aren’t quite built for luxury, but whom sellers try to market and price as luxury homes).
Here is a breakdown per town: This is the price range at which homes listed for sale belong to the top, or the bottom of the K, based on what town they are in. Please note that to match the K shape demand, the supply charts for a given town should be looking like a “V”.
RIFLE/SILT
NEW CASTLE
GLENWOOD SPRINGS
CRYSTAL VALLEY
CARBONDALE
BASALT
Rifle and Silt are the only towns in the valley where the bottom of the K is supplied. every other town from New Castle to Basalt has too many expensive listings, and not enough attainable ones.
Quick quality control of the supply, and how it impacts the transactions
Each segment of the market also needs to be put into its context. Despite the fact that the top of the K shape is oversupplied, prices are remarkably stable in that segment of the market. That’s because the sellers are typically in no rush to sell. They are usually sitting on a great amount of equity, little to no leverage, and can wait until somebody offers them what they are looking for. Also the listings that are comparable to theirs and that actually closed did so at a high price, which might trick every other seller in that price range that they are just waiting for their turn. It’s hard to drop your price when your neighbor just sold for more than what you are listed at. Though the question remains… How many qualified buyer are actually looking for you type of property? Some sellers at the top of the K might have to wait for quite a long time… The result of this dynamic is: Very high average sale price at the top of the K, yet high days on market and slow pace of transaction for that segment of the market.
At the bottom of the K, we typically see more buyers than listings. But there is, a lot of the times, a big problem in the quality of those homes listed at an attainable price. Buyers at the bottom of the K are stretching in every way possible to make it work for themself, and they are being offered homes that need work, and usually a lot of it. Renovating is expensive, and buyers at the bottom of the K might not have access ot the capital necessary to buy a home and renovate it. So despite the demand outpacing supply at the bottom of the K, we still see a slow pace in that segment of the market as well. Expect for the properties that are both attainable and move in ready.
What’s hot in this market
In this context, this is what to sell right now:
An affordable home move in ready
A luxury home with assets that are hard to come by, and that a wealthy buyer would jump on: large home hard to replace at a resonable cost, river front, seclusion, views etc…
What’s a hard sell right now
The following are hard to sell in the current market:
A tired house priced only slightly under comps
Luxury homes lacking the wow factor
Homes at good locations, that would command a higher price, but that weren’t built or updated for luxury living. They then fall into the soft middle of the K. Too expensive for regular folks, not good enough for luxury buyers. Unfortunately, there are a lot of homes that fit this definition in our valley. Most of the towns in the mid valley became destinations for luxury buyers, but homes were originally built for mere mortals and don’t meet the expectations of current wealthy buyers.
Make sure you know where you are positioned on the K as you go into a transaction!
You understood it, there are a serious impairment between the supply and demand of homes right now. The game of tug a war between buyers and sellers is raging at the margins. To the buyer’s advantage at the top of the K, and to the seller’s advantage at the bottom. Anecdotal sales that are way above past comparables, and servicing the top of the K, might push up average sales prices and show appreciation year over year, while homes sit on the market at a lower price point in the exact same area.
If you are a buyer, you are in a buyer’s market at the top of the K, and a seller’s market at the bottom. Act accordingly: at the top of the K, you can be demanding and negotiate. At the bottom, winning means getting the deal done. Reach out here if you are looking for a home and want an agent who knows their market!
If you are a seller, you are in a buyer’s market at the top of the K, and a seller’s market at the bottom… Act accordingly: At the top of the price range, you have a lot of competition. Accomplish every marketing effort you can, make sure to nail every showing. Don’t leave anything to chance. At the bottom of the price range, you have the upper hand. Price slightly above the latest comps, and keep in mind that you are likely dealing with buyers who don’t have a ton of room in their budget. Despite market balancing your way, you can only ask so much of them before you lose them. On both ends of the K, be patient and price smartly!